According to the most recent national Government statistics, people across the UK are cycling less often and for shorter distances now than in 2020. This is partly due to 2020 being a record year for cycling due to the pandemic, with 29% more people on average cycling compared to 2019. But a post-pandemic re-adjustment isn’t the only reason figures have dipped dramatically in some cities.
We wanted to understand why some areas have much lower cycling rates than others. While other parts of the country have returned to normal after the high uptake rates of 2020, data for many cities in England shows that participation in cycling was, and still is, far below average. This is an ongoing issue, so we’ve looked into what could be done to improve the cycling situation in these cities.
Which cities are cycling the least?
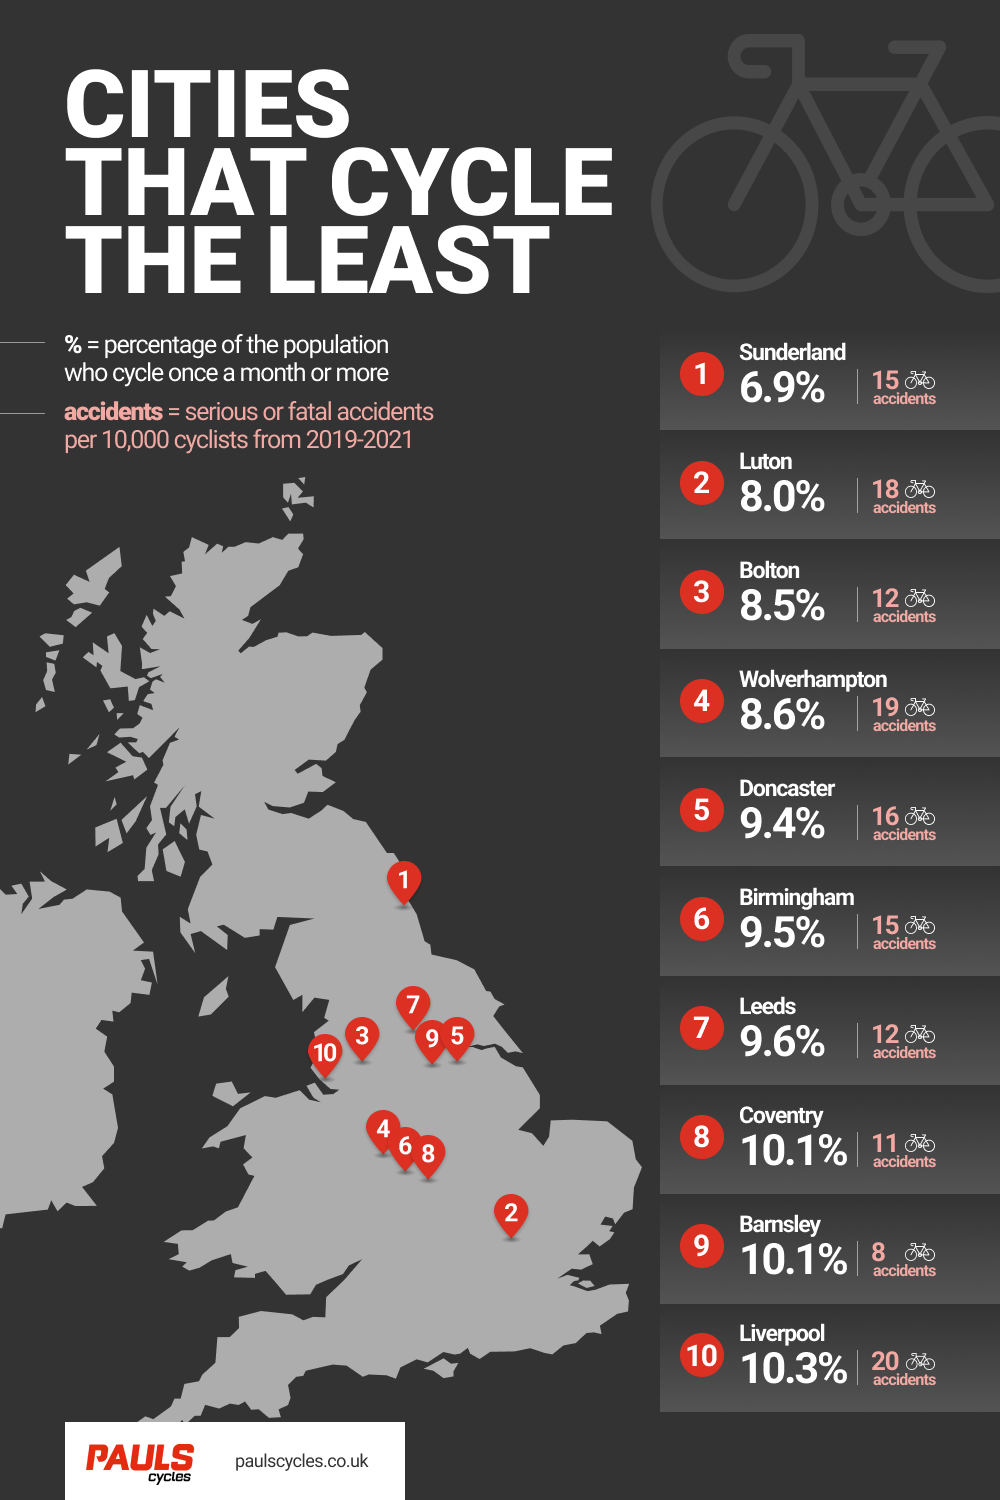
We looked at the percentage of people from each city in England with a population of at least 200,000 who cycle at least once a month for any reason. From this, we found the 10 cities from across England which cycle the least. These cities, and the % of their population that cycles once a month or more, are:
- Sunderland – 6.9%
- Luton – 8%
- Bolton – 8.5%
- Wolverhampton – 8.6%
- Doncaster – 9.4%
- Birmingham – 9.5%
- Leeds – 9.6%
- Coventry – 10.1%
- Barnsley – 10.1%
- Liverpool – 10.3%
These cities have consistently had fewer cyclists even before the record levels of 2020, indicating that there are underlying factors in why their populations are less likely to get into cycling than others. But what are they? From accidents and injuries to lack of cycle path access, we’ve investigated the limiting factors that could be putting would-be cyclists off from taking to the road.
What is stopping people from cycling?
The first barrier issue we wanted to explore was cost. Real prices, and perceived expense, are often cited as a barrier to entry for many hobbies and activities, and cycling is no exception.
However, when looking at the data, we found that the cost of bikes and accessories isn’t a top barrier to cycling. According to a Government survey conducted in May 2021, 27% of people say that having cheaper bicycles available would encourage them to cycle more, but only 6% cited the cost of a suitable bicycle as a reason for not cycling at all.
So, if the cost of cycling isn’t a big factor in stopping people from cycling, then what is? The same data holds some answers. When those who cycle occasionally were asked what would get them cycling more, the top five choices were:
- Off-road and segregated cycling paths (55%)
- Safer roads (53%)
- Well-maintained road surfaces for cycling (49%)
- More direct cycle routes (43%)
- More information/awareness about local cycle routes (36%)
Most respondents defined ‘safer roads’ as those with more considerate drivers, less traffic, and slower driving speeds. Let’s take a closer look at some top concerns, and at some of the regions most affected.
Fear of accidents and injuries
Safer roads and segregated cycling paths would encourage many people to cycle more, and we believe they’d also help to get more non-cyclists cycling in the first place. But how big is the current risk of taking to Britain’s roads by bike?
When taking into account the population of each city and (importantly) cycling rates, the bottom 10 cities have on average higher accident rates than the top 10 cities.
In fact, we found that the top 10 cities by cycling rate have had around 5 major and fatal accidents per 10,000 cyclists over the last three years, compared to 15 per 10,000 cyclists for the bottom 10 cities.* Particularly notably, Cambridge, which has the highest rate of cycling in the UK, only had 2 major or fatal accidents in the last 3 years per 10,000 cyclists.
Why some cities are more affected than others
Some cities with the lowest cycling rates initially appear to have relatively large amounts of cycle lanes and user-uploaded mapped cycle paths. So why do they still have so few cyclists?
Sunderland
Government figures show that just 6.9% of Sunderland’s population cycles at least once per month, meaning that around 93% of the city’s inhabitants cycle less frequently or not at all. Here, the major or fatal accident rate for the last three years is 15 incidents per 10,000 cyclists, which is well above average for England.
Sunderland does have off-road cycle paths which cyclists can use to get from the city centre to surrounding urban areas. However, the local government has noted that more needs to be done to overcome barriers to cycling, and for this reason has pledged to build more direct cycle routes which are segregated from both pedestrian and motor traffic.
Luton
Luton has a road network of which 2% is cycle lanes, which puts it in the top 10 cities by percentage of cycle lanes in the entire UK. Clearly, the quantity of cycle lanes is not what’s keeping cyclists from Luton’s roads, yet only 8% of local residents are cycling on an even semi-regular basis.
Luton’s accident rate is 18 per 10,000 cyclists across the years we’ve studied – coming close to double the rate seen in the cities that have the most keen cycling populations. In this city, the majority of cycle lanes are shared with pedestrians, rather than being cycle lanes fully segregated from both pedestrians and from motor traffic. These lanes are less direct routes than most roads will be, are generally slower, and scarry more risk of collision than a fully segregated lane.
Birmingham
Birmingham is also a frequent appearance on lists related to the total number of cycle lanes, largely thanks to its canal cycle lane system. However, these canal routes do not align with the general road network, meaning that cycling is not a complete alternative to driving, and cycle lanes are once again not segregated from pedestrians.
In fact, 76% of West Midlands residents noted that cycle lanes segregated from both pedestrians and from traffic would encourage them to cycle more, indicating a lack of practical and safe cycle lanes ideal for everyday use. We can see this idea in the earlier-mentioned national data, where 36% of respondents said that ‘more direct cycle routes’ would encourage them to cycle more. Here, as in Sunderland, the accident rate is 15 major or fatal injuries per 10,000 cyclists.
Cycling stereotypes
Among those who stated that no changes or improvements would encourage them to cycle more, 25% of respondents said that it was due to safety concerns. The only response given more frequently was ‘cycling is not for people like me’ at 27%.
While we can’t say for certain what the details behind this statement are, we suspect that stereotypes around cycling are causing some people to choose other methods of transport. The idea that most cyclists are ‘Middle Aged Men in Lycra’ is certainly entertaining, but for people in other demographics, that stereotype has the potential to deter budding cyclists from participating. Even middle aged men with an aversion to lycra could be deterred!
One noteworthy trend that appeared during lockdown was a 50% increase in the number of women cycling on Britain’s roads. Sadly, things are now back to usual with the latest government data showing a 50% decrease in female cycling participation since 2020. Colloquial insights note that women are often more likely to have safety concerns than men, with worries about vulnerability on the road not limited to the risk of unsafe driving by other traffic.
While this data isn’t city-specific, it does pose the question of how to increase cycling rates among all genders in cities and regions where road traffic accidents and other risk factors are particularly high.
Additionally, the Sunderland City Council notes that if a two-mile cycle route was to become a three-mile one (for example due to a detour), young men would be 11% less likely to choose to cycle whereas young women would be 19% less likely.
So how to get more people cycling?
Evidence has shown that introducing cycle lanes can increase the number of people who cycle each week by 35%. In some cases, new cycling routes have boosted cycling as much as 72%!
Hanif Khan, a previous councillor and Cabinet member of Transport for Hounslow Council, illustrated the link between cycle lanes, safety, and increased rates of cycling by saying:
“’This new data is evidence of how effective the trial cycle lane in Chiswick has been, especially in reducing collisions. It is great that families can cycle around the borough together and feel safer than ever before.”
However, it is important that the cycle lanes are practical for everyday transport use, allowing cyclists full access to the general road network. Scenic cycle lanes are great, but they do not provide a complete replacement for driving. Additionally, cycle lanes which are fully segregated from both motor traffic and from pedestrians are consistently given as a primary factor in the rate of cycling.
There are other factors too which could encourage people to cycle more, such as ensuring greater availability of secure bike storage to reduce and prevent bicycle theft. There are things we can all play an active role in – raising awareness from ourselves and other road users about safety around cyclists, particularly when a cycle lane isn’t available, and tackling stereotypes. At Paul’s, we think cycling can be for everyone!
We can’t see exact figures for how many cycle lanes the cities in our 10 least cycled cities have, and how many of these are fully segregated, but we can see that the northern cities do appear to be over-represented. Cycling infrastructure is a form of investment, and balancing the north-south divide in terms of investment received will help to more closely align Liverpool and Leeds with places such as Cambridge.
How you can help make things better
Even if you or someone you know are not currently a cyclist, you may be in the future! But if not, there are plenty of economic and environmental reasons to want cycle lanes in your town or city. Some things you can do to help get more people cycling include:
- Contacting your MP or local council to encourage them to increase and improve cycling routes in your local area
- Starting or signing a petition to gain more support for change (this is how the Dutch were able to get such great and comprehensive cycle lanes implemented in their cities!)
- Signing up to a cycling awareness campaign, for example one of the campaigns on CyclingUK
- Support and promote local cycling clubs
Bikes for every ability and budget
At Paul’s Cycles, we carry a wide range of affordable bikes for a range of cycling disciplines and styles. If you’re looking to take advantage of the cycle lanes in your city, then our range of road bikes should have the perfect choice, whether you are a seasoned cyclist or are brand new! For countryside adventures, explore our range of mountain bikes, too.
Being cyclists ourselves, we would love for more people to feel confident about getting out there, and we hope to be able to show people that cycling can be for everyone. That’s why at Paul’s Cycles, we offer free expert advice and consultation around finding the perfect bike for you.
Data & Methodology
Sources cited here are linked where mentioned, but include:
- https://www.gov.uk/government/statistics/walking-and-cycling-statistics-england-2021
- https://www.gov.uk/government/statistics/national-travel-attitudes-study-wave-5
- https://www.sciencedirect.com/science/article/pii/S2214140520301626#tbl1
- https://tfl.gov.uk/info-for/media/press-releases/2021/july/new-data-highlights-success-of-trial-cycleway-in-chiswick
- https://www.cyclinguk.org/article/six-reasons-build-cycle-lanes
Cities rated as the worst for cycling were identified based on government data showing the % of each city’s population that cycles at least once per month. Only areas with a population of 200,000 or more were included to ensure data wasn’t skewed by small sample sizes or missing data.
Metropolitan boroughs with 200,000 or more people but for which fewer than 200,000 live in administrative centres were also excluded, in order to keep conditions for each population as close as possible (in this case, urban).
*We calculated this by using the total populations for the top 10 and the bottom 10 cities, and applying the average once-a-month cycling rates for the respective set to find a ‘cycling population’


